2 Nov 2022
Drug Trends output:
Trends in drug-related hospitalisations in Northern Territory, 1999-2021

Trends in drug-related hospitalisations in Northern Territory, 1999-2021
.cropimg.width=700.crop=video.png "NIDIP NDARC Web banners 16 x 9 - 23")
Key findings
This summary report presents findings on all drug-induced deaths (i.e., overdose and other drug-induced deaths where drugs have been deemed the underlying cause of death) in the Northern Territory from 1999-00 to 2020-2021.
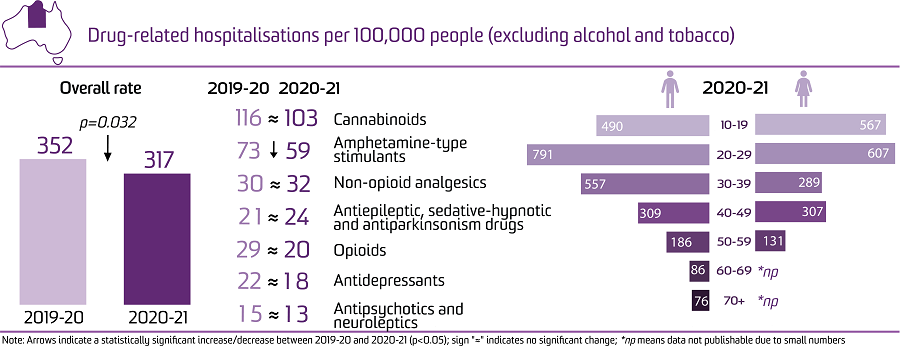
There were 828 hospitalisations with a drug-related principal diagnosis in the Northern Territory in 2020-21.
This is equivalent to 317 hospitalisations per 100,000 people, which was a significant decrease from 2019-20 (352 hospitalisations per 100,000 people; p=0.032), although is a four-fold increase from 1999-00 (90 hospitalisations per 100,000 people).
These findings are part of the national report Trends in drug-related hospitalisations in Australia, 1999-2021.
Our public online data visualisation allows viewers to disaggregate data in different ways, and to download these images for their own use.
Chrzanowska, A., Man, N., Akhurst, J., Sutherland, R., Degenhardt, L. & Peacock, A. (2022). Trends in drug-related hospitalisations in Australia, 1999-2021. Sydney: National Drug and Alcohol Research Centre, UNSW Sydney. DOI: 10.26190/wrsv-3b78
We acknowledge the Australian Institute of Health and Welfare and jurisdictional data custodians for the provision of data from the National Hospital Morbidity Database.
The Drug Trends program is funded by the Australian Government Department of Health and Aged Care under the Drug and Alcohol Program.
Please note that any representation of these data should include an acknowledgment of Drug Trends at the National Drug and Alcohol Research Centre, University of New South Wales.
©NDARC, UNSW SYDNEY 2022
This work is copyright. You may download, display, print and reproduce this material in unaltered form only (retaining this notice) for your personal, non-commercial use or use within your organisation. All other rights are reserved. Requests and enquiries concerning reproduction and rights should be addressed to the information manager, NDARC, UNSW Sydney, NSW 2052, Australia via drugtrends@unsw.edu.au.
2 Nov 2022
National Illicit Drug Indicators Project (NIDIP) reports
Download this resource
Contact
Research areas
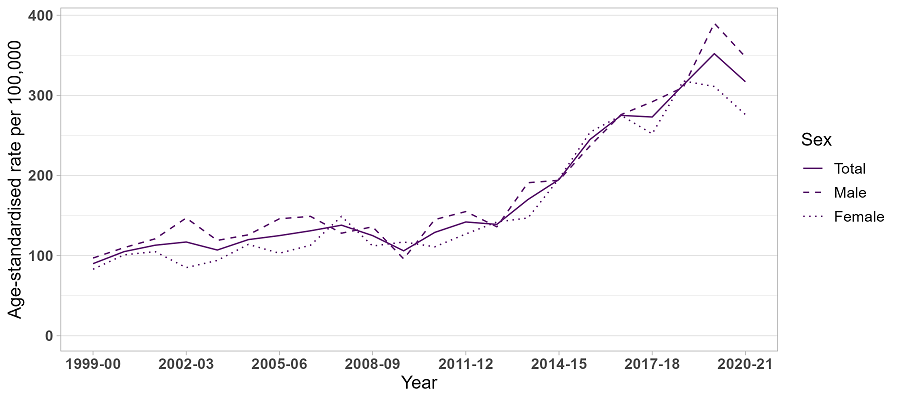
The rate of hospitalisations was higher among males than females in 2020-21 (348 versus 276 hospitalisations per 100,000 people, respectively).
In 2020-21, the rate of hospitalisations was among the 20-29 age group, followed by the 10-19 and 30-39 age groups (701, 565, and 422 hospitalisations per 100,000 people, respectively). Among both males and females, the rates of drug-related hospitalisations were highest in the 20-29 age group.
The highest rate of hospitalisations in 2020-21 was observed in the remote and very remote Northern Territory (393 hospitalisations, 360 per 100,000 people), while the number of hospitalisations was highest in the outer regional Northern Territory (434 hospitalisations, 287 per 100,000 people), noting there are no major city areas or inner regional areas in the Northern Territory.
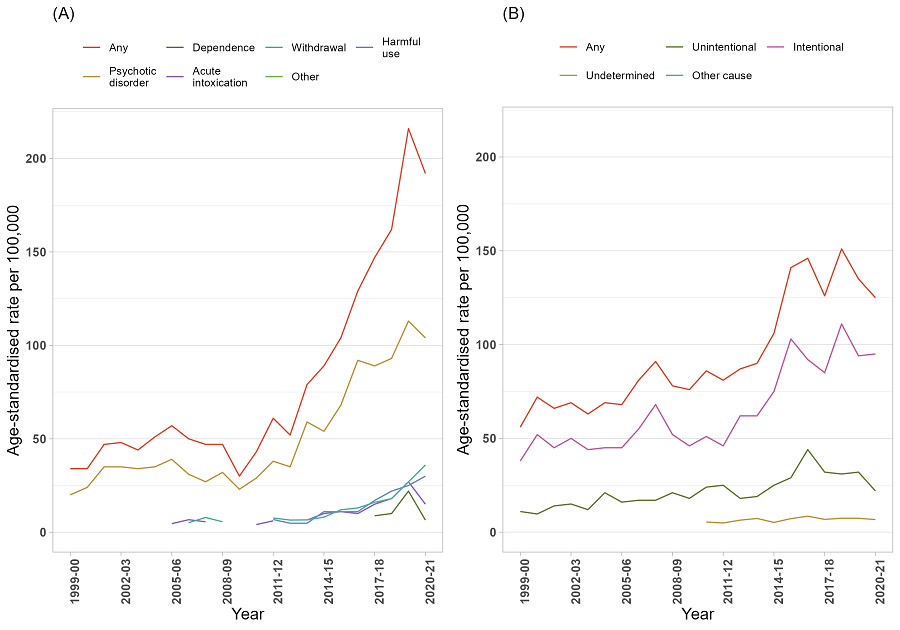
In 2020-21, 38% of drug-related hospitalisations in the Northern Territory were due to drug poisoning. Furthermore, 77% of drug poisoning related hospitalisations were intentional (95 hospitalisations per 100,000 people) and 17% were unintentional (22 hospitalisations per 100,000 people).
In 2020-21, the rate of hospitalisations was highest where there was a principal diagnosis indicating cannabinoids (103 hospitalisations per 100,000 people).
Compared to 2019-20, there was a significant decrease in 2020-21 in the rate of hospitalisations related to amphetamine-type stimulants (p=0.043).
Age-standardised rate per 100,000 people of drug-related hospitalisations, by sex, the Northern Territory, 1999-00 to 2020-21.
Age-standardised rate per 100,000 people of drug-related hospitalisations, by remoteness, the Northern Territory, 2012-13 to 2020-21.
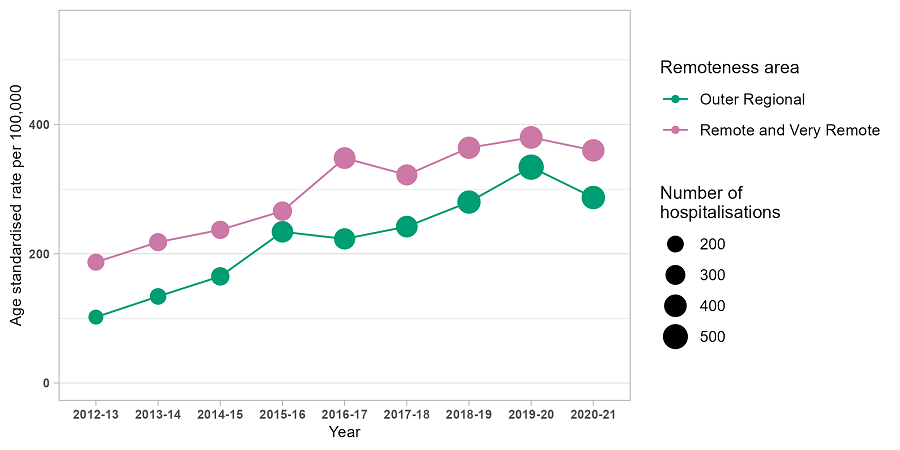
Note: The size (area) of the bubble is proportional to the number of hospitalisations. There are no major city areas and inner regional areas in the Northern Territory. Data on remoteness are only available from 2012-13.
Age-standardised rate per 100,000 people of drug-related hospitalisations, by principal diagnosis of mental and behavioural disorder due to substance use (A) and external cause of poisoning (B), the Northern Territory, 1999-00 to 2020-21.
Age-standardised rate per 100,000 people of drug-related hospitalisations, by drug identified in the principal diagnosis, the Northern Territory, 1999-00 to 2020-21.
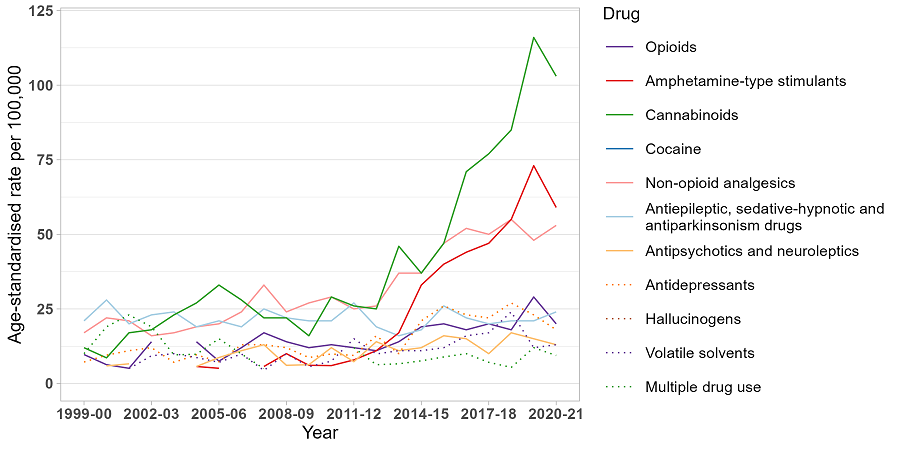
Note: Age-standardised rates were not calculated if the number of hospitalisations was less than or equal to 10 (please refer to our document for details). Suppressed data are visible as gaps in the data series