28 Jul 2022
Drugs and New Technologies (DNeT):
Trends in the availability and type of drugs sold on the internet via cryptomarkets, June 2021 – May 2022

Trends in the availability and type of drugs sold on the internet via cryptomarkets, June 2021 – May 2022
Drug Trends has identified, crawled (or ‘scraped’), extracted, categorised and analysed drug listings on cryptomarkets on a regular basis since 1 February 2014. This bulletin series reports on trends in the availability and types of drugs sold on the internet via cryptomarkets over a 12-month period (a new bulletin is released typically every 4 months). The current bulletin focuses on analysis of drug listings on cryptomarkets from 1st June 2021 to 31st May 2022.
An accompanying public online interactive data visualisation is available, allowing viewers to interact with data collected over the total monitoring period.
Dr Nicola Man,
Research Fellow,
T +61 (02) 8936 1217,
E n.man@unsw.edu.au
28 Jul 2022
Drugs and New Technologies (DNeT) Bulletins
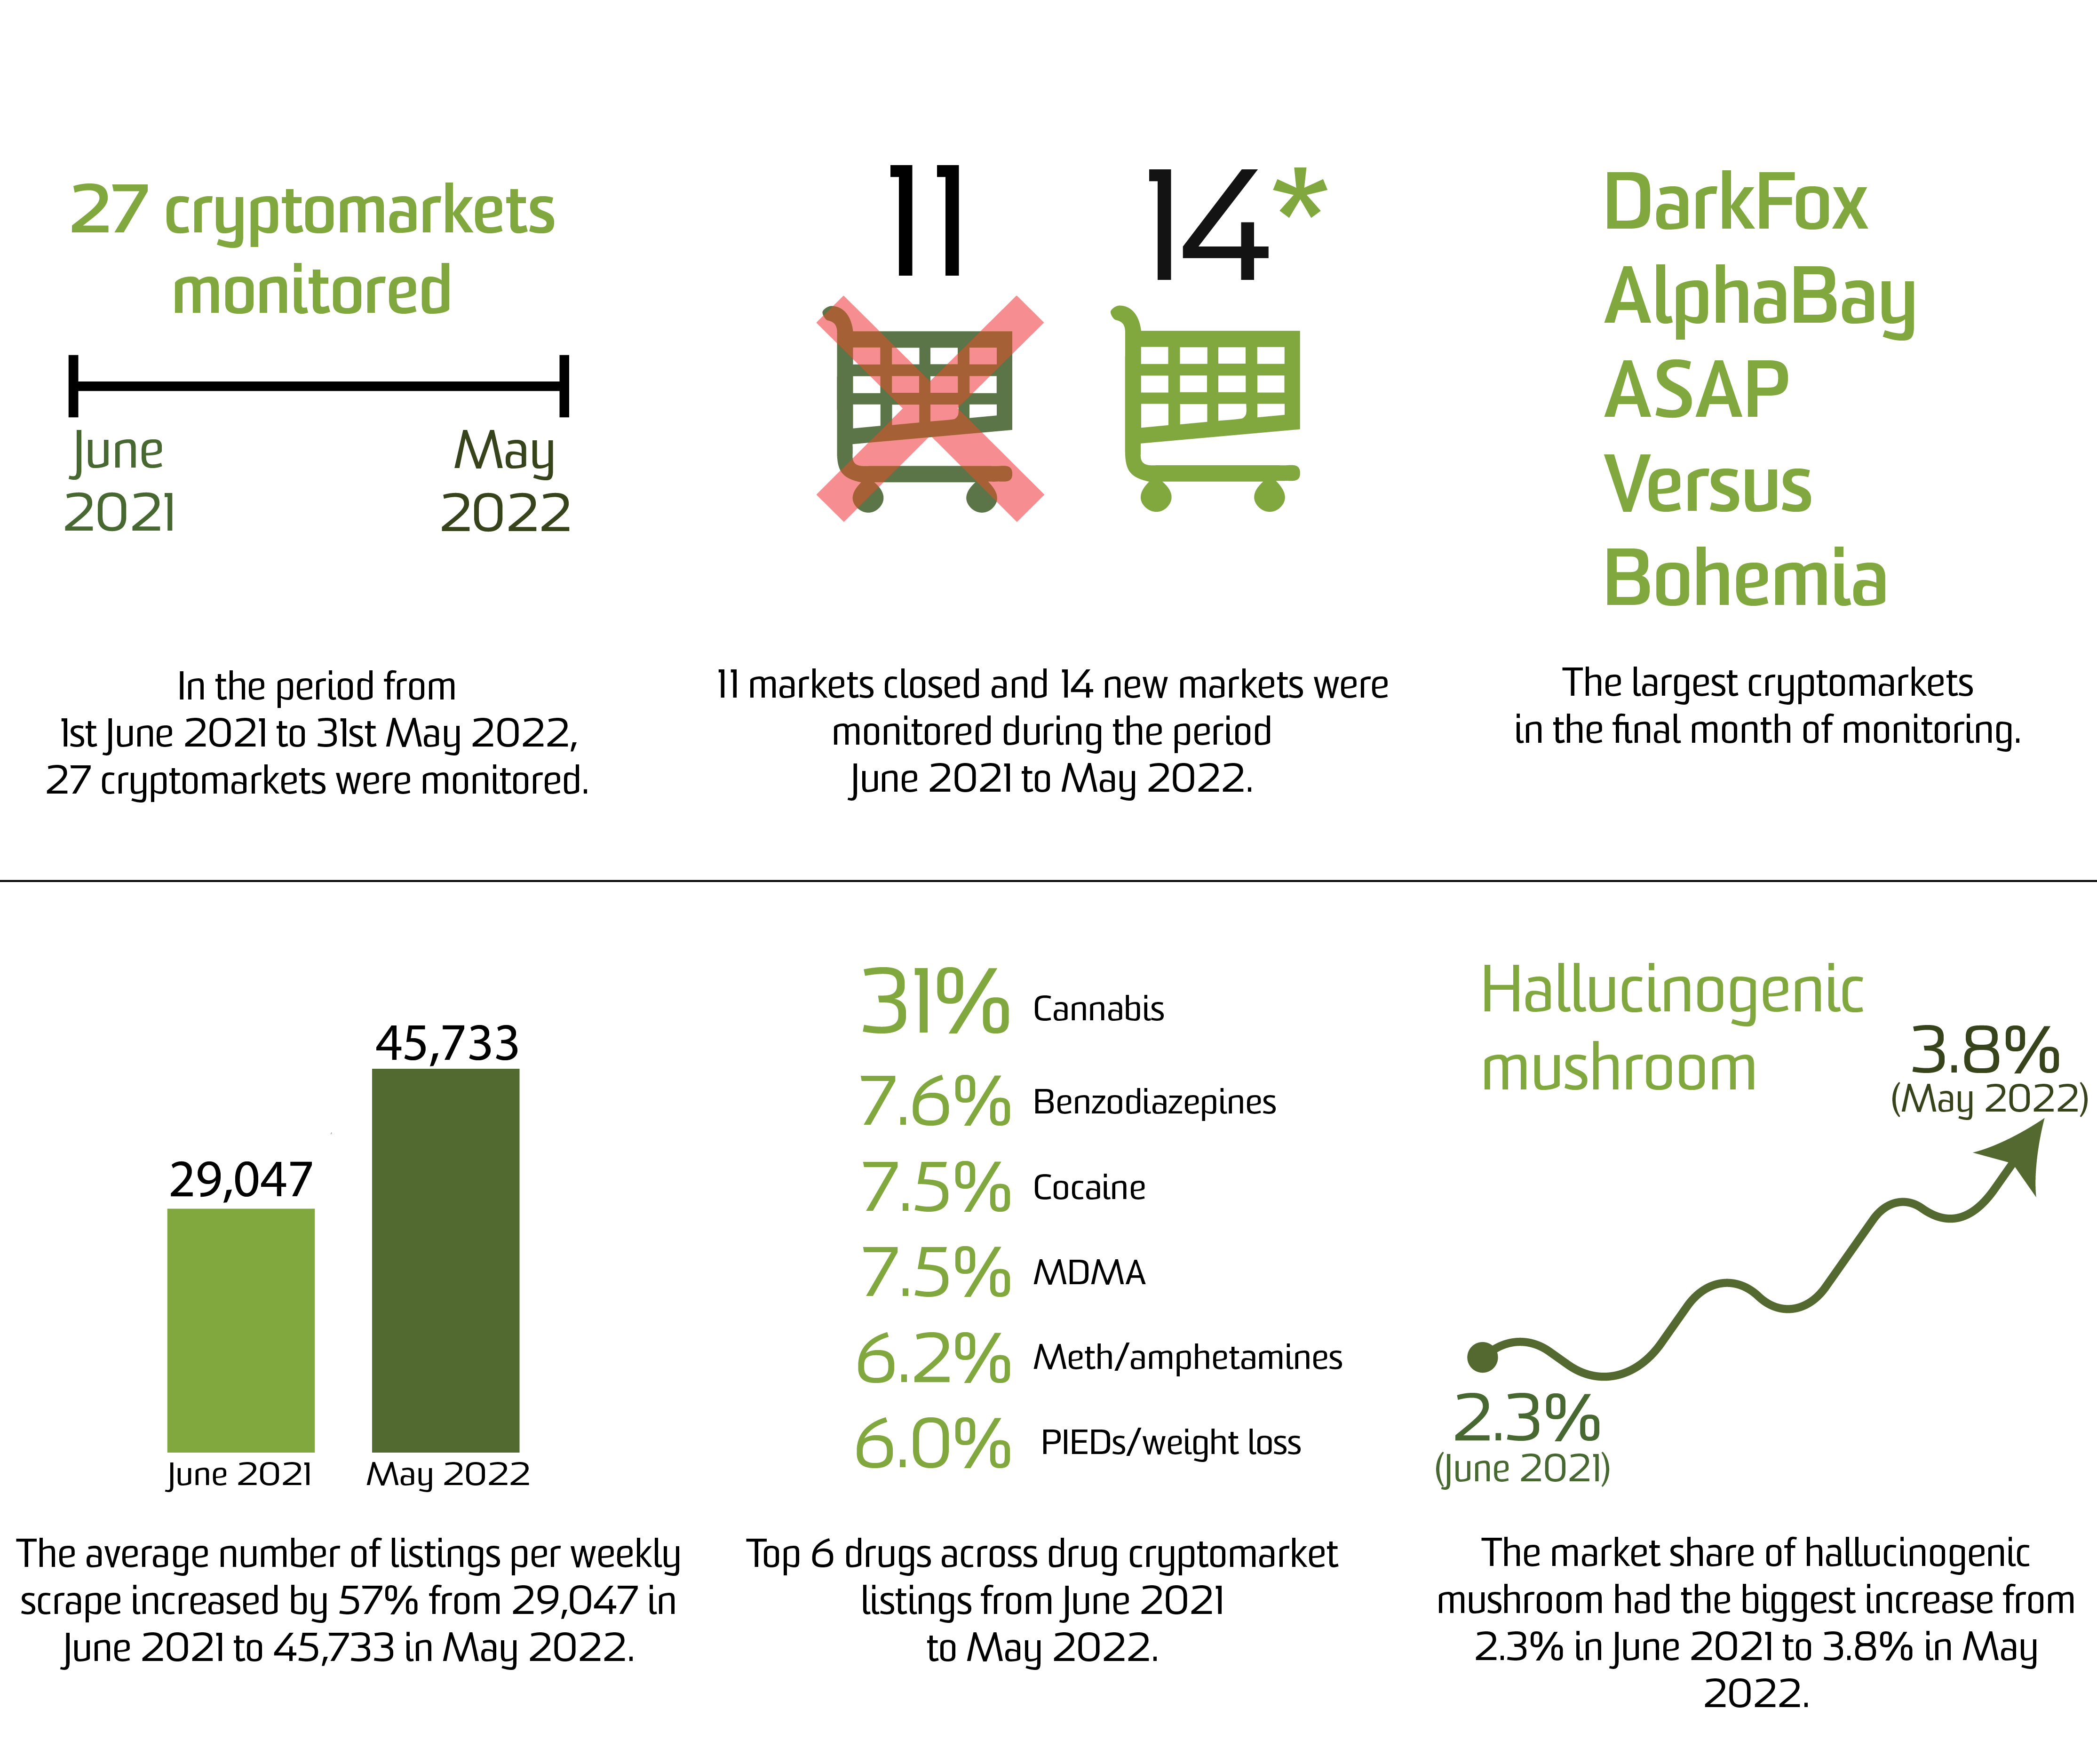
From 1st June 2021 to 31st May 2022, 27 cryptomarkets were monitored weekly, of which 11 closed before the end of the reporting period. We began monitoring 14 new cryptomarkets during this period.
Only the largest markets by average number of weekly listings in the 12-month period are shown in the plot.