
Airborne Remote Sensing Facility

The Airborne Remote Sensing Unit is an integral component of the School of Aviation Flying Operations Unit, and is located in Hangar 135 Aviation Place, Bankstown Airport. This page provides a summary of capabilities and activities, focussing on beach erosion and deposition, vegetation and topographic studies, and outlining the new area of methane source assessments.
-
The Unit operates a twin-engined Piper PA 44 Seminole, registered VH-UNG, which is fully approved for commercial aerial survey operations and for flight under the Instrument Flight Rules, and which meets current requirements for scientific flight instrumentation. With one seat removed for instrumentation, the Seminole is a 3-seat aircraft with a cruise speed of around 250 km/h and a range of 1200 km, and an airborne endurance of over 210 minutes, depending on fuel and payload.
Modifications to the aircraft to facilitate scientific surveys are fully approved and include an observation port in the floor of the rear luggage compartment which allows a direct and unimpeded view of data acquisition equipment of the earths surface below the aircraft. Scientific power is available from either or both of the engines alternators, and an instrument rack is fitted to enable attachment of various types of scientific equipment.
The primary equipment is a Riegl VQ480i airborne scanning laser which transmits and receives lidar return data from the earth’s surface. The VQ480i acquires multiple returns, has a cross-track field of view of 60o, uses scan rates from 50 – 550 KHz, and is effective up to a height of 700 m above the earth’s surface. To facilitate positioning, the lidar also uses a Novatel OEMV precision dual-frequency carrier-phase receiver, and a Novatel SPAN HG1700/H62 tactical grade inertial sensor. The Novatel Waypoint GPS/IMU software Riegl RiProcess is used to post-process the data. Survey flight lines can be created and followed using the navigational GPS, or the scientific GPS. A 50 megapixel Canon camera allows acquisition of visual images for descriptive or stereoscopic analyses. At 1000 ft altitude, the swath width is over 300 m, and with a groundspeed of about 70 ms-1 we can capture a beach such as Wamberal in less than a minute of flight time, but with over 10 topographic data points per m2. Accuracy is better than 10 cm vertically, and 15 cm horizontally. At 1500 ft altitude the data density is lower, but the swath width wider.
New scientific equipment purchased for aerial survey use include a Picarro 2401-m Gas analyser, which will be housed in the cabin, and that will be used to assess ambient air gas concentrations, and an Aventech AIMS-30 meteorology probe which will acquire outside air temperature, humidity, temperature and wind velocity.
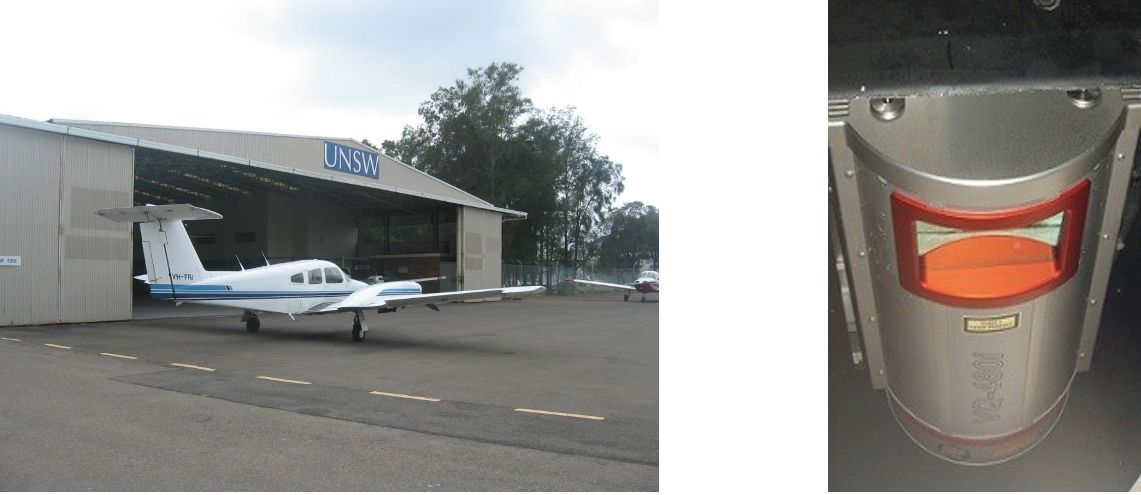
The Piper PA 44 Seminole VH-UNG and the Riegl VQ480i as seen from below the observation port
-
Early work at UNSW using airborne lidar was conducted at Lady Elliot Island in 2008 (Melville et. al., 2012). Observations of beach erosion from the northern Sydney beaches began in 2011, and with an early paper by Middleton et. al. (2013) defining the resolution an accuracy of airborne lidar. A well-cited study by Harley et al. (2017) used UNSW airborne lidar to describe and analyse erosion at beaches from Coffs Harbour to Sydney that occurred during a major storm from 5th to 7th June, 2016.
The processes of erosion and deposition of sand along Australia’s beaches are complex, and depend on a large number of factors including tide height, wave height and incident direction, and wind. Broadly speaking erosion occurs during intense storm events of large waves and high winds, for example in North Narrabeen in 2016, over 180 m3 of sands were removed from a linear metre segment of beach over 3 days. Deposition happens very slowly over a number of months of milder conditions as wind waves gradually replenish the sand. Replenishment happens in the swash zone where waves are active, and the process of beach replenishment is finished off by winds that drive dry sands in to the dune areas. The balance between erosion and deposition depends primarily on the frequency and strength of storms. With a groundspeed of about 70 ms-1 , and a swath width of 300 m, we can capture topography for a beach such as Wamberal in less than a minute of flight time, but with over 10 topographic data points per m2. Accuracy is better than 10 cm vertically, and 15 cm horizontally. Here we present data from surveys undertaken since 2016, to allow readers to understand some of the complexities.
A plan view of sands lost between 5th April 2016 and 22nd July 2020 in the Wamberal beach area is shown in Figure A. The dark blue colour indicates no changes, and is evident for the fixed topography of building and roads. The red shading on some roofs is false and should be ignored, and arises from a data density difference from the two surveys. On the beach itself the colour shades represent changes in topographic beach heights, as indicated by the colour bar scale. Blue indicates no change while red indicates changes in excess of 3m. The red shading in the area of beach near the Profiles line directly abuts the blue of residential infrastructure, indicating major losses at the edge of and within private properties. At Wamberal a significant width of beach has shown over 3m loss of sand height over the 5-year period, and this loss is not just in a small area of beach but extends for hundreds of metres alongshore. The scale of sand loss is clearly huge.
Comparing profiles obtained at different times gives us some idea of the complexity of changes. Figure B shows cross sectional beach profiles taken at the section indicated in Figure A on five different dates. The red profile was obtained before the East Coast Low event of 5th June 2016, and shows a gradually sloping beach all the way from the ocean up toward the houses, with a small coastal dune at the top of the beach. Much of this was swept away during that storm event as indicated by the green profile obtained on 7th June 2016. The blue profile of 11th June 2018 shows that a significant amount of sand has returned to the beach, but mostly on the lower beach by wave action, and sand has yet to build up near the steep areas abutting the housing. By 18th June 2016 after a small storm, the outer beach had lost a metre or two of sand, while the main slope near the housing was unaffected. The last profile taken recently on 22nd July shows that all of the gains since July 2016 were lost and the beach is almost non existent, with sand cliffs next to housing of slope approximately 0.8 (40o), steeper than the angle of repose for dry sand slopes to remain stable.
So the descriptive story is straightforward, and with Dr Kathleen McInnes of CSIRO forecasting that storms will potentially become more numerous and stronger as sea level rises and climate warming drives more water vapour into our atmosphere, coastal erosion is likely to become more severe, not less.
Experts in coastal erosion and coastal engineering in local Universities, the NSW State Government, and local councils are looking into solutions for sensitive “hotspots” of erosion in NSW, but as Dr Mitchell Harley, a beach erosion expert from UNSW indicates “There is no easy solution”. Climate change and its impacts will remain one of our biggest challenges.
Ongoing beach topographic studies have continued with funding from the NSW Department of Planning and Environment, and data is archived with public access at NSW Beach Profile Database.
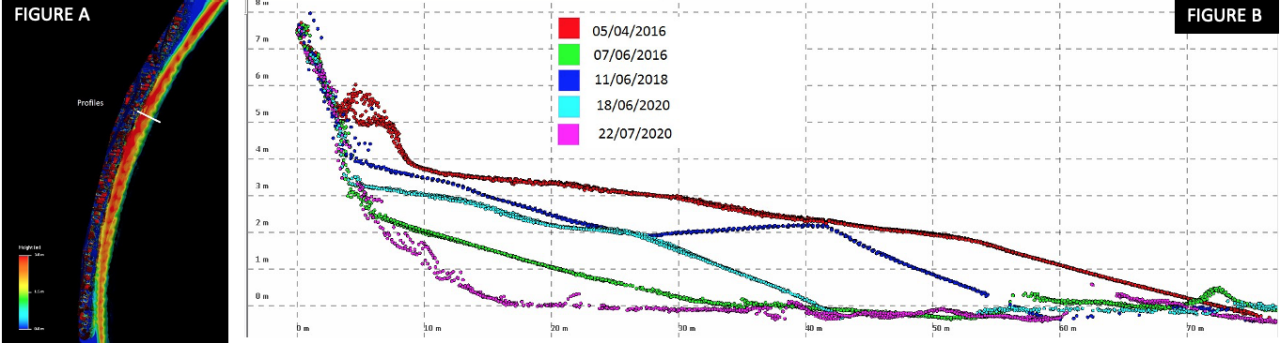
Beach erosion and deposition results from Wamberal, NSW over a 5 year period
-
In February, 2019, the aircraft was in southern Queensland, and the opportunity arose to undertake a lidar and aerial photographic survey of Lady Elliot Island, the most southern cay of the Great Barrier Reef. This was a follow up to research that was undertaken in 2008. The first sub-section below describes the lidar data, while the second concerns the aerial photography.
Lidar Data
Accuracy of the lidar is better than 30 cm horizontally and 10 cm vertically (Middleton et al, 2013). Lidar pulses are emitted via a scanning mechanism that provides returns from a swath approximately 250 m wide at 1000 ft altitude. The aircraft flies at approximately 50m s-1, so the lidar will survey approximately 12500 m2. s-1 . Each square metre will have up to 10 points of return, and creating an overlap of all survey swaths gives 20 points m-2, taken from different angles. This provides penetration through the canopy to lower levels of vegetation and to the ground, allowing estimation of mid level vegetation heights as well as the canopy and ground surface. Flights are conducted along parallel tracks so the surveys cover the island with overlapping swaths to ensure that data density is adequate. The basic ground topography can be deduced from the last lidar return data set, and this is shown in Figure 1.

Figure 1
Showing the ground topography above low tide level, which is defined as the set of last lidar returns from the 2019 survey. Buildings are included as they are higher than the ground. The Lighthouses are excluded by the contouring smoothing. The highest topography is about 5m above low tide level.
A false-colour image of the canopy of Lady Elliot as obtained from the first returns is shown in Figure 2. The resort buildings are located on the south-eastern quadrant of the island, and the grass covered runway which is 800 m long and 70 m wide runs approximately north-south from beach to beach across the entire island. There is a pedestrian pathway with low grass running from the resort to the south-western side of the island where there are two light-houses, 3 housing structures, and 2 sheds.
The colour bar indicates heights in metres above sea level. To gain an idea of the nature of the lidar images, a brief description of the vegetation is useful. The tall trees just to the southwest of the swimming pool are old naturally-occurring Pisonia trees and these have a relatively dense top canopy.Other Pisonia trees line the southern edges of the walkway to the west, and these were planted by the Resort owners in the last decade. The northern beaches either side of the runway end are fringed by Casuarina trees, but have extensive Octopus bushes beneath.
The highest point of the island is only about 5 m above low water, or 3 m above high tide, and is at the northwest corner of the island. Sandy beaches with relatively smooth contours run from low water to the vegetated area. Changes in beach topography can easily be detected by repeat surveys as have been done a number of times in other places (see for example, Harley et al, 2017). Deducting the ground topography from the canopy heights gives a direct measure of the vegetation heights. This is shown in Figure 2(B).

Figure 2(A)
A false colour image of the Lidar returns from an aerial survey of lady Elliot Island. The colour bar at the left shows heights above means sea level

Figure 2(B)
A false colour image of the height of vegetation above the ground. The data in Figure 2(B) is created by subtracting topographic heights of Figure 1 from Figure 2(A)
One way of depicting the vegetation density as a function of height is to plot vertical cross-sections of the canopy, and these are shown in Figure 3. The dot point depictions show the heights at which the lidar signals are reflected, and so are a direct measure of the height and density of the vegetation. One east-west cross section runs from the runway east at northern end of the Island, and the other from the lighthouse to the resort.

Figure 3
Cross sections of lidar returns at two selected east-west sections, showing vegetation, open areas and the built environment. Trees in the left figure are Casuarina, with a low-density foliage. The solid brown patch of vegetation just east of the Runway in the right image is Pisonia, and the canopy is very dense there
For selected small areas, density of returns can be plotted as a function of height, depicting different vegetation levels, and an example of this is shown in Figure 4.
Models of LiDAR data can be supplied in the GeoTIFF format for importing into commonly used GIS software for further analysis and presentation.

Figure 4
Showing a plot of the vertical changes in density of point returns. This effectively defines the canopy as being most dense at the 8 m level, while there is a secondary maximum of return at the 2 m level where there is another sub-canopy
Photographic Data
The canon 50 megapixel camera is operated in such a way that there is overlap between all photographs. A complete and detailed image of the island exists from the 2019 surveys and is of size several hundred gigabytes. Selected screen shots are shown below to demonstrate the resolution and capability.

Figure 5(A): An aerial photograph showing the cross-section area of Figure 3(A).
Figure 5(B): An aerial photograph showing the cross-section area of Figure 3(B).
Figure 5(C): Showing some of the Lagoon directly east of the resort with corals and a boat. The boat is approximately 7 m in length.
In summary, the combination of lidar and aerial photographs enables a visual and quantitative estimate to be made of the type and extent of habitat. Change in such habitat can be determined by comparison of results from successive years.
-
This project was led by Elise Pendall of Western Sydney University, and was aimed as understanding the effects of bushfires on scribbly gum and ironbark dominated woodlands on the Cumberland Plains of Western Sydney. Impacts of fire frequency (0– 4 in last 25 years) and time since fire (0.5 to >25 years) were assessed for canopy structure, habitat quality and biodiversity (e.g., species richness). Our airborne lidar was used to assess canopy height and density, and ground‐based surveys of 148 (400 m2) plots measured leaf area index (LAI), plant species composition and habitat metrics such as litter cover and hollow‐bearing trees. Findings indicate biodiversity and canopy structure are generally resilient to a range of times since fire and fire frequencies across this study area.
Figure from Pendall et. al. (2022) is attached below.

Examples of Scribbly Gum Woodland recovery from fire:
- (A) six weeks after fire
- (B) one year after fire
- (C) 14 years after fire
- (D) lidar-derived canopy profile transect through SGW one year since fire (left) to eight years since fire (right) (y-axis scale indicates height above sea level)
-
This project is being led by Bryce Kelly of UNSW, and our role involves the estimation of methane fluxes from various sources by aerial data acquisition. Sources include concentrated sources such as underground coal mine vents, open cut coal mines, animal feed lots, farms more generally, and waste disposal sites.
A new Picarro 2401-m Methane/Co2 Gas analyser has been ordered, and will be utilised for aerial flux assessment studies toward the end of 2022. These studies will also utilise concurrent data acquired by Aventech AIMMS-30 meteorological probe.
This project is in its early phase, and funding is currently being sourced for a wide ranging program of source assessments. Aerial surveys will be used to provide estimates of total fluxes, which will be compared against ground-based estimates.
Recent studies worldwide have emphasised that current ground based estimates are often significantly lower than the actual emissions, and that aerial assessments have significant capability to provide accurate results.

An image showing concentrations of methane measured during a flight from Bankstown Airport (right side of image) to Douglas Park, NSW (left side of image) where a vent from the Appin coal mine is located
-
Following the disastrous and extensive flooding of the northern rivers in 2022, we were commissioned by the NSW State Government to undertake studies of the Northern Rivers. The objective was to aerial survey the river banks and surrounding areas of the Richmond River and its catchment rivers including towns of Kyogle and Casino, and the Wilson River and its catchments around Lismore. We also surveyed downstream areas of Coraki, Woodburn, Broadwater and the wetland areas around Ballina to the river mouth, and the Brunswick river system including the area of Mullumbimby. Data analyses and interpretation for this project are ongoing.

An image of part of the river valley near the town of Kyogle, Northern NSW, produced from Lidar data
-
A number of studies have been undertaken to survey road and rail corridors in areas where drones are unable to operate or areas which are extensive geographically. One example is Heathcote Road in southern Sydney where the ANSTO restricted zone, Holsworthy military zone and the Sydney Airport control zone create complex flight approval requirements. Long surveys include the new England Highway in NSW, and the Narrabri to Northstar rail corridor. Other projects included a survey of Noosa Airport, and of the Crookwell wind farm. These projects have been commercial in nature with the main deliverable being topographic data to a commercial surveying company.
-
- Huang, Z.C. Huang, Z.C. B. Reineman, L. Lenain, W.K. Melville, and J.H.
- Middleton (2012) Airborne LIDAR measurements of wave energy dissipation in a coral reef lagoon system, Journal of Geophysical Research, 117, C03016, doi:10.1029/2011JC007203, 2012
- Middleton J.H., C.G. Cooke; E.T. Kearney; P.J. Mumford, M.A Mole, G.J. Nippard C. Rizos, K.D. Splinter and I.L. Turner (2013) Resolution and accuracy of an airborne scanning laser system for beach surveys, Journal of Atmospheric and Oceanic Technology, vol. 30, pp. 2452 - 2464, http://dx.doi.org/10.1175/JTECH-D-12-00174.1
- Harley, M., Turner, I., Kinsela, M., Middleton, J.H., Mumford, P., Splinter, K., Phillips, M., Simmons J., Hanslow, D. and Short A. D. (2017) Extreme Coastal Erosion enhanced by anomalous extra-tropical storm wave direction, Nature Scientific Reports, 7: 6033 | DOI:10.1038/s41598-017-05792-1.
- Pendall, E., Hewitt, A, Boer, M.M., Carrillo, Y., Glenn, N.F., Griebel, A.; Middleton, J.H., Mumford, P.J., Ridgeway, P., Rymer, P.D. and Steenbeeke, G.L. (2022) Remarkable Resilience of Forest Structure and Biodiversity Following Fire in the Peri‐Urban Bushland of Sydney, Australia. Climate 2022, 10, 86. https://doi.org/ 10.3390/cli10060086