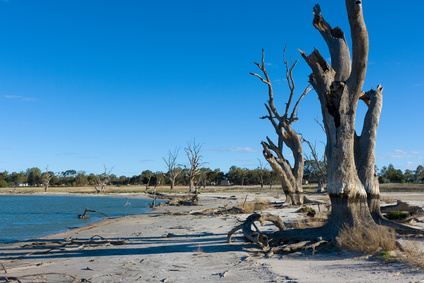
Fortunes of Australia’s breadbasket wax and wane in response to drought and rainfall
Published on the 22 Jun 2018

Using historic satellite data from NASA, research led by UNSW scientists has shown the health of the Murray-Darling Basin vegetation and the surrounding ecosystem responded in sync with water availability in the region. UNSW scientists analysed more than a quarter of a century of the dramatically changing water expanses in the Murray-Darling Basin, which they mapped in unprecedented detail using Landsat satellite images from 1986 to 2011.
“The information can help regional water managers make evidence-based solutions about how best to allocate the basin’s precious water resources between the competing needs of agriculture, industry, the local community and the environment,” said Dr Mark Broich, the lead author of the study.
The work was published in Remote Sensing of Environment.
The Murray-Darling Basin spans nearly 14% of the Australian continent – almost 250 million acres that stretch across 4 states and encompass two major rivers, the Murray River and the Darling River. The area is responsible for half of Australia’s wheat production, home to a quarter of its cattle and half of its sheep. The Basin’s significance to Australian agriculture has earned it the moniker ‘Australia’s breadbasket’. Scattered throughout the Basin are over 200 wetlands nationally recognized as biodiversity hotspots, and 16 of the Basin’s wetlands are listed as internationally recognized Ramsar convention sites. The Basin is a crucial breeding site for waterbirds.
Prior studies have attempted to tease out if rainfall or flooding in the Basin is the main driver of vegetation greening. They often came to different conclusions – until Dr Broich and his team at UNSW’s Geospatial Analysis for Environmental Change lab harnessed the existing Landsat data coverage for the Basin. The team used over 25,000 Landsat images collected between 1986 and 2011 in concert with rainfall data from the Australian Bureau of Meteorology to create a Basin-wide vegetation response map.
The resulting research provides the first full-Basin look at how the floodplain vegetation utilized and responded to available water. It found that rainfall and flooding worked in sync and in traceable and distinct spatial patterns. The data gives scientists a valuable bird’s eye view on how vegetation flourished responding to historic flooding patterns in the region, and how it dwindled with drought.
In particular, the data showed the dramatic impact of the onset of the Millennium Drought in Australia that spanned over 15 years from 1996-2010. The drought caused dramatic shifts in the spatial patterns of vegetation response and the role of flooding.
Using statistical modelling, Dr Broich’s team found that vegetation response within the Basin varied greatly with location. Flooding was much more influential than rainfall in downstream areas. Most regions experienced flooding very infrequently; in those places rainfall was king green-maker, but in downstream regions, this relationship was flipped.
Downstream floodplain locations flood more often since they receive the aggregate drainage of all of their upstream river networks—in other words, they “catch” the collective water of their catchment (drainage basin).
This also means that peak floods in these regions rarely happen at the same time as local rainfall since there is a lag time between when rain falls upstream and when it shows up downstream.
“Landsat is the only satellite data archive that allows the quantification of vegetation and flooding dynamics across such a vast area with a level of spatial detail that water managers are happy to work with,” says Dr Tulbure, one of the lead authors on the paper.
The historic and continuous nature of the Landsat data archive is what enabled Dr Broich’s team to measure this vegetation response in terms of timing, magnitude, and location.
“Landsat program satellites allow us to focus on phenomena such as droughts and floods that occur over both short and multi-decadal timeframes and impact large regions at a spatial resolution relevant for local management,” says Dr Broich.
The Landsat is a NASA-managed program that represents the world’s longest continuously acquired collection of imagery captured via satellite. The data has proven to be an invaluable record and has been used in emergency response and disaster relief.
The methodologies developed by Dr Broich’s team can be translated to other semi-arid basins around the world that are facing similar water allocation struggles such as California’s Central Valley, the Colorado River basin, and the Iberian Peninsula.
Based on the Landsat Science News article “Rain Showers, Flowers, and Floods: Understanding How Vegetation Responds to Flooding and Drought in Australia’s Breadbasket.”