Traffic jams are contagious. Understanding how they spread can help make them less common
A new model based on how diseases spread will help traffic controllers get on top of congestion faster.
A new model based on how diseases spread will help traffic controllers get on top of congestion faster.

Traffic jams may have disappeared from our roads as people stay home during the COVID-19 pandemic, but we can be confident they will be back. Scientists have studied traffic and congestion for decades.
We know a lot about how traffic jams form, how they spill from one road to another, and also how can we stop them happening and help cities recover.
Our research shows that traffic congestion spreads through a city like a disease. Using this insight we have created a simple model based on a contagion model often used to predict the spread of illness, which produces results quickly and can help traffic controllers respond in real time to traffic jams.
The study, carried out with colleagues at the University of California, Berkeley, and Johns Hopkins University, is published in Nature Communications today.

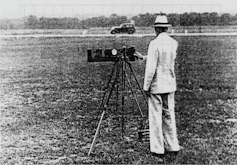
Pioneering traffic researcher Bruce Greenshields using a movie camera to measure traffic flow in 1933. 75 Years of the Fundamental Diagram for Traffic Flow Theory, Transportation Research Circular, Number E-C149, June 2011
The first simple description of traffic flow based on observations was published in 1933 by the American researcher Bruce Greenshields. This was only 25 years after the production of the first Ford Model T in 1908.
Greenshields used a movie camera to take consecutive pictures with a constant time interval to measure traffic. Since then, numerous data collection and modelling techniques have been developed.
Today, the most advanced method to measure and monitor traffic in cities uses anonymous location data from mobile phones with sophisticated mathematical and computer simulation models. The most recent example of such powerful data sources and analysis techniques are the community mobility reports recently released by Google, which show changes in mobility in cities around the world due to the spread of COVID-19.

The DynaMel model describes traffic flow in Melbourne. University of New South Wales (UNSW Sydney)
Many existing models describe traffic well but require so much computational power that it is difficult to use them in real time for traffic control. In a large metropolitan area, these models often take tens of minutes or hours to run, even using cloud-based and other high-performance computing technologies.
While this may not sound like a big deal for transport planning purposes, it is actually one of the biggest hurdles for their use in practice for traffic operations and control. To overcome this challenge, scientists have more recently started searching for simpler ways of describing and predicting urban traffic congestion.
Scientists use contagion models to describe the spread of an infectious disease in a population, as well as things like the spread of a computer or mobile phone virus through the internet and the spread of news or misinformation on social media.
We have shown that a similar modelling framework can be used to describe how traffic jams spread in cities. We adopted what is called the susceptible-infected-recovered (SIR) model, commonly used in epidemics, and applied it to traffic jams in Sydney, Melbourne, New York, Chicago, Montreal and Paris.
In the traditional model, epidemiologists divide a population into groups of people who are susceptible to a disease, people who are infected, and people who have recovered. In ours, we divide a road network into free-flowing roads, congested roads, and recovered roads.
Every road in the network belongs to one of these categories, and the state of traffic on each one can change over time. A free flow link might become congested and a congested link could become recovered as time passes.
Our new model shows that the spread of traffic congestion can be characterised with a universal measure similar to the basic reproduction number, known as R0 in the epidemic models. This number represents how quickly congestion spreads through a city, independent of the topology, urban form and network structure of the city.
We empirically verified our results with traffic data from Google and a computer simulation model of the Melbourne metropolitan area.

The model shows how congestion and recovery spread through a traffic network. University of New South Wales (UNSW Sydney)
The new findings can be used for adaptive and predictive control of congestion in cities. While the model does not specify which streets are congested, it provides aggregate information on what percentage of links in the network are congested.
This information can be used to develop control strategies to cut down how long the congestion lasts or to keep the number of congested roads below an acceptable threshold.
Potential congestion mitigation strategies that could benefit from these findings include perimeter traffic control of city centres, improving signal timing and removal of bottlenecks.
Meead Saberi, Senior lecturer, UNSW
This article is republished from The Conversation under a Creative Commons license. Read the original article.
![]()