

The output of a tensile test is a graph giving the load versus the resulting extension of the test piece. These curves are dependent on the test piece size. If the test piece is larger it will require a larger load to give the same extension.
Therefore, in order to normalise across a range of different size test pieces, the load and extension are converted to engineering stress and engineering strain respectively (we will simply refer to these as stress and strain).
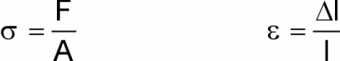
 σ = stress
F = force applied (load)
A = cross-sectional area
ε = strain
δl = change in length
l = original length
Stress and strain are then plotted instead of load and extension, giving an engineering stress-strain curve, which is not dependent on the area or size of the test piece.
These curves can then be compared between different test pieces and different materials.